
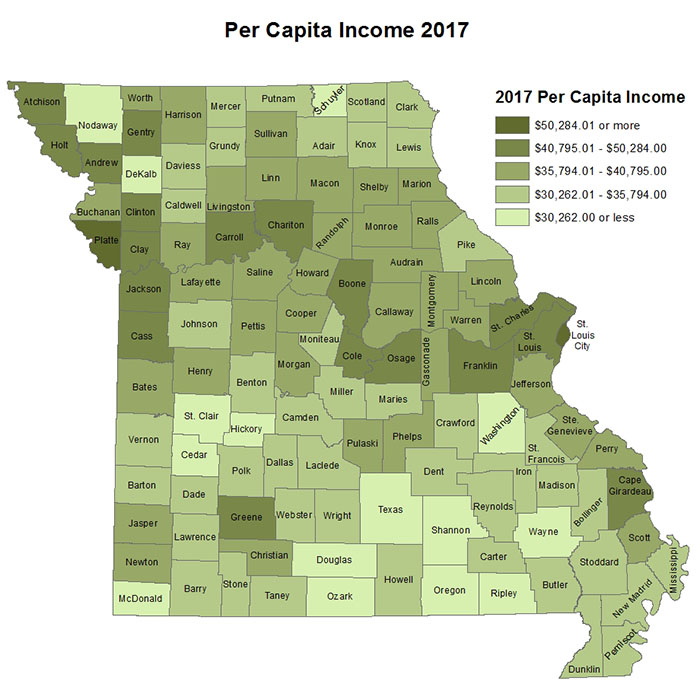
Missouri had a per capita income in 2017 of $44,978. Per capita income is defined as total personal income divided by total population. Seven Missouri counties had higher per capita incomes in 2017 than the state. Those counties were St. Louis, Platte, St. Charles, Holt, Clay, Atchison, and Cass. Per capita income levels for Missouri tend to be highest around larger metro areas while the lower per capita income levels tend to be located in the south central parts of Missouri.
| 2017 Top Missouri Counties Per Capita Income | ||
|---|---|---|
| Rank | Area | 2017 Per Capita Personal Income |
| 1 | St. Louis | $67,029 |
| 2 | Platte | $54,893 |
| 3 | St. Charles | $50,284 |
| 4 | Holt | $46,194 |
| 5 | Clay | $46,026 |
| 6 | Atchison | $45,975 |
| 7 | Cass | $45,075 |
| 8 | Boone | $44,797 |
| 9 | Cole | $44,783 |
| 10 | Jackson | $44,432 |
| 11 | St. Louis City | $43,577 |
| 12 | Cape Girardeau | $43,556 |
| 13 | Carroll | $43,508 |
| 14 | Osage | $42,816 |
| 15 | Andrew | $42,782 |
| 16 | Franklin | $41,887 |
| 17 | Chariton | $41,686 |
| 18 | Clinton | $41,554 |
| 19 | Greene | $41,344 |
| 20 | Gentry | $41,287 |
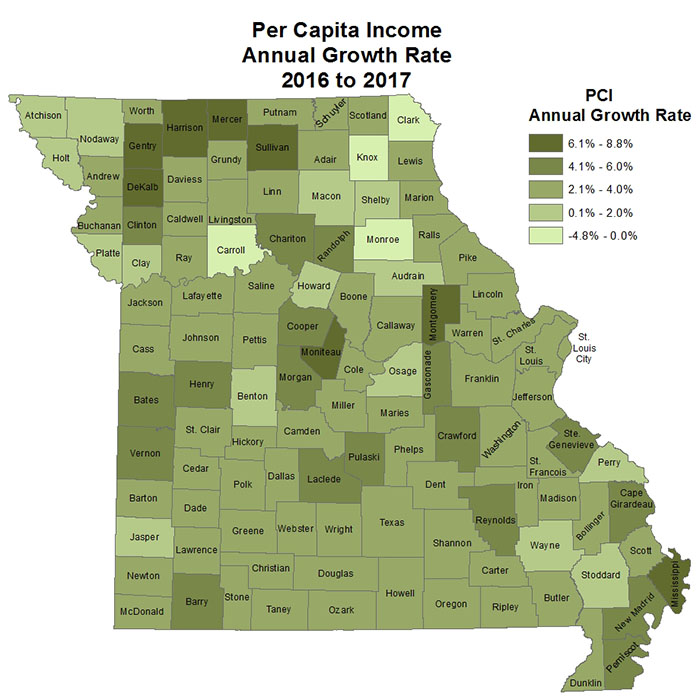
Missouri's per capita income grew by 3.2 percent from $43,587 in 2016 to $44,978 in 2017. Analysis of the 2017 per capita income showed that 48 of the 115 counties grew faster than the state average. The counties with the highest per capita income growth rates tend to be counties located in or near metropolitan areas.
Only 3.5 percent of Missouri counties had negative per capita income annual growth rates from 2016 to 2017, down significantly from the previous year, which was at 22 percent. Farm income increased for the state between 2016 and 2017 by 12.9 percent, steady growth from the previous year.
| Per Capita Income and Annual Growth Rate, Missouri Counties | ||||||||
|---|---|---|---|---|---|---|---|---|
| Area | 2016 Per Capita Income | 2017 Per Capita Income | 2016 to 2017 Annual Growth Rate | Area | 2016 Per Capita Income | 2017 Per Capita Income | 2016 to 2017 Annual Growth Rate | |
| Missouri | $43,587 | $44,978 | 3.2% | Linn | $36,357 | $37,090 | 2.0% | |
| Adair | $31,186 | $32,037 | 2.7% | Livingston | $36,856 | $38,010 | 3.1% | |
| Andrew | $41,817 | $42,782 | 2.3% | Macon | $40,185 | $40,631 | 1.1% | |
| Atchison | $45,624 | $45,975 | 0.8% | Madison | $34,371 | $35,432 | 3.1% | |
| Audrain | $37,992 | $38,228 | 0.6% | Maries | $30,991 | $31,955 | 3.1% | |
| Barry | $31,948 | $33,277 | 4.2% | Marion | $37,762 | $38,916 | 3.1% | |
| Barton | $33,340 | $34,589 | 3.7% | McDonald | $26,161 | $27,094 | 3.6% | |
| Bates | $35,026 | $37,037 | 5.7% | Mercer | $31,784 | $33,890 | 6.6% | |
| Benton | $33,447 | $33,736 | 0.9% | Miller | $33,672 | $34,635 | 2.9% | |
| Bollinger | $30,554 | $31,478 | 3.0% | Mississippi | $30,036 | $32,093 | 6.8% | |
| Boone | $43,816 | $44,797 | 2.2% | Moniteau | $33,192 | $35,375 | 6.6% | |
| Buchanan | $36,686 | $37,779 | 3.0% | Monroe | $41,233 | $39,260 | -4.8% | |
| Butler | $33,923 | $34,789 | 2.6% | Montgomery | $38,397 | $40,795 | 6.2% | |
| Caldwell | $33,789 | $35,121 | 3.9% | Morgan | $38,306 | $39,893 | 4.1% | |
| Callaway | $35,135 | $36,418 | 3.7% | New Madrid | $29,607 | $31,290 | 5.7% | |
| Camden | $34,558 | $35,598 | 3.0% | Newton | $36,136 | $37,232 | 3.0% | |
| Cape Girardeau | $41,799 | $43,556 | 4.2% | Nodaway | $28,602 | $29,079 | 1.7% | |
| Carroll | $44,245 | $43,508 | -1.7% | Oregon | $27,357 | $28,022 | 2.4% | |
| Carter | $30,237 | $31,090 | 2.8% | Osage | $42,521 | $42,816 | 0.7% | |
| Cass | $43,878 | $45,075 | 2.7% | Ozark | $28,407 | $29,142 | 2.6% | |
| Cedar | $29,395 | $30,262 | 2.9% | Pemiscot | $31,694 | $33,326 | 5.1% | |
| Chariton | $39,820 | $41,686 | 4.7% | Perry | $37,959 | $38,628 | 1.8% | |
| Christian | $37,185 | $38,310 | 3.0% | Pettis | $35,284 | $36,186 | 2.6% | |
| Clark | $34,764 | $34,332 | -1.2% | Phelps | $36,147 | $37,422 | 3.5% | |
| Clay | $45,210 | $46,026 | 1.8% | Pike | $32,943 | $33,735 | 2.4% | |
| Clinton | $39,320 | $41,554 | 5.7% | Platte | $53,956 | $54,893 | 1.7% | |
| Cole | $43,284 | $44,783 | 3.5% | Polk | $30,991 | $31,938 | 3.1% | |
| Cooper | $35,412 | $36,872 | 4.1% | Pulaski | $37,839 | $39,542 | 4.5% | |
| Crawford | $33,570 | $35,282 | 5.1% | Putnam | $33,760 | $34,693 | 2.8% | |
| Dade | $32,824 | $33,748 | 2.8% | Ralls | $39,098 | $40,220 | 2.9% | |
| Dallas | $31,232 | $32,308 | 3.4% | Randolph | $36,837 | $38,726 | 5.1% | |
| Daviess | $32,726 | $34,028 | 4.0% | Ray | $39,078 | $40,116 | 2.7% | |
| DeKalb | $25,690 | $27,236 | 6.0% | Reynolds | $30,675 | $32,238 | 5.1% | |
| Dent | $30,806 | $31,454 | 2.1% | Ripley | $29,058 | $30,206 | 4.0% | |
| Douglas | $25,511 | $26,463 | 3.7% | Saline | $37,170 | $38,228 | 2.8% | |
| Dunklin | $31,826 | $32,790 | 3.0% | Schuyler | $26,572 | $27,614 | 3.9% | |
| Franklin | $40,586 | $41,887 | 3.2% | Scotland | $31,653 | $32,434 | 2.5% | |
| Gasconade | $35,719 | $37,472 | 4.9% | Scott | $37,070 | $38,255 | 3.2% | |
| Gentry | $38,785 | $41,287 | 6.5% | Shannon | $27,585 | $28,210 | 2.3% | |
| Greene | $40,137 | $41,344 | 3.0% | Shelby | $37,338 | $37,346 | 0.0% | |
| Grundy | $32,491 | $33,508 | 3.1% | St. Charles | $48,568 | $50,284 | 3.5% | |
| Harrison | $33,930 | $36,931 | 8.8% | St. Clair | $28,385 | $28,955 | 2.0% | |
| Henry | $38,718 | $40,307 | 4.1% | St. Francois | $31,330 | $32,349 | 3.3% | |
| Hickory | $25,681 | $26,346 | 2.6% | St. Louis | $42,490 | $43,577 | 2.6% | |
| Holt | $45,791 | $46,194 | 0.9% | St. Louis City | $64,533 | $67,029 | 3.9% | |
| Howard | $37,106 | $37,470 | 1.0% | Ste. Genevieve | $35,591 | $37,106 | 4.3% | |
| Howell | $30,995 | $31,931 | 3.0% | Stoddard | $34,762 | $35,407 | 1.9% | |
| Iron | $31,759 | $32,894 | 3.6% | Stone | $34,660 | $35,794 | 3.3% | |
| Jackson | $43,103 | $44,432 | 3.1% | Sullivan | $36,193 | $38,892 | 7.5% | |
| Jasper | $37,450 | $38,150 | 1.9% | Taney | $33,547 | $34,394 | 2.5% | |
| Jefferson | $38,922 | $40,192 | 3.3% | Texas | $25,597 | $26,425 | 3.2% | |
| Johnson | $33,608 | $34,550 | 2.8% | Vernon | $33,736 | $35,519 | 5.3% | |
| Knox | $32,878 | $32,165 | -2.2% | Warren | $38,039 | $39,093 | 2.8% | |
| Laclede | $32,464 | $34,317 | 5.7% | Washington | $27,438 | $28,139 | 2.6% | |
| Lafayette | $39,181 | $40,657 | 3.8% | Wayne | $28,368 | $28,879 | 1.8% | |
| Lawrence | $31,247 | $32,399 | 3.7% | Webster | $30,502 | $31,268 | 2.5% | |
| Lewis | $31,907 | $32,809 | 2.8% | Worth | $35,226 | $36,236 | 2.9% | |
| Lincoln | $37,575 | $38,584 | 2.7% | Wright | $29,959 | $30,848 | 3.0% | |
Source: Bureau of Economic Analysis
Note-- All dollar estimates are in current dollars (not adjusted for inflation).